
Assign tasks to users to enable them to monitor surveys using maps. #
Through “Task Assignment” you can define the user responsible for monitoring each survey using the map, by assigning the areas that each researcher is accountable for. This helps facilitate and organize the data collection process. To select an area and assign a user to it using maps, follow these steps:
- Select “ Assign Tasks “
 from the side control menu.
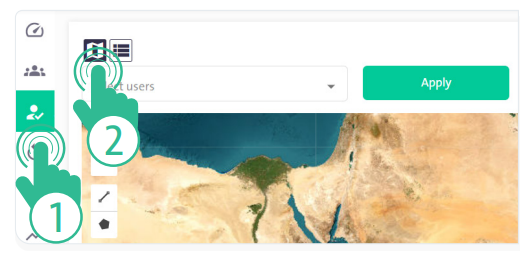
- Click the “Map” icon
 to assign tasks using maps
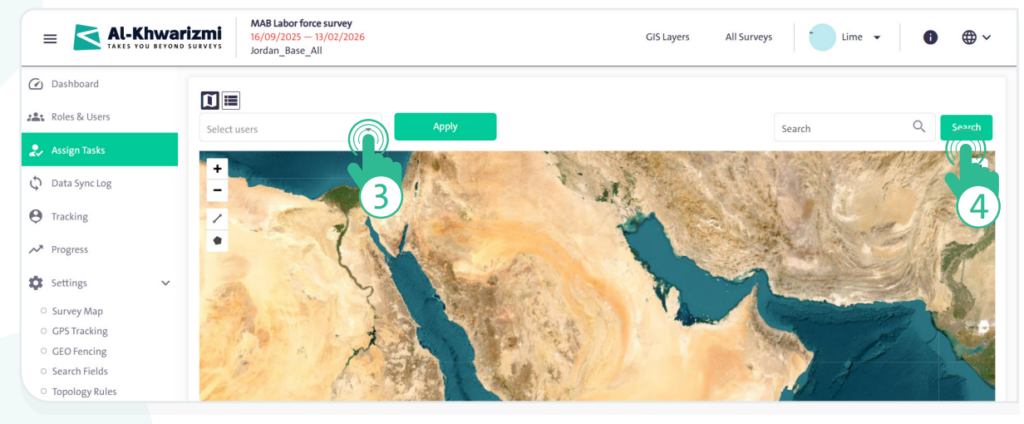
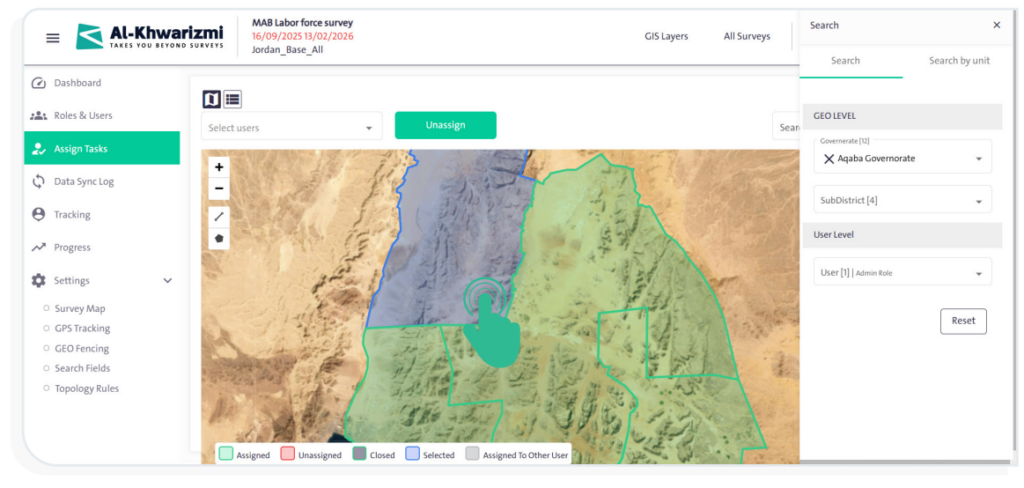
 - From the “Select Users” dropdown menu at the top of the geographic map, choose the user to whom the assignment will be made.
- Click “Search” to display the geographic layer to be assigned.
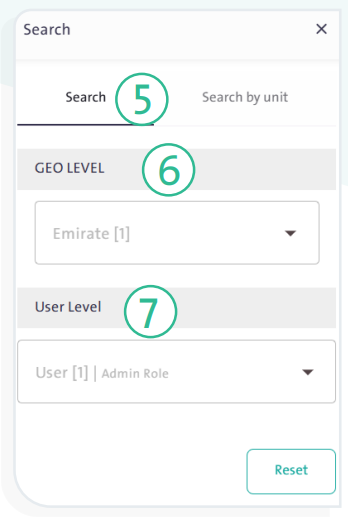
- Select the “Search” tab, then follow these steps:
- Define the geographic level, which can include governorate, city, district, neighborhood, and street.
- Define the user level by selecting either “User” or “Sub-user” if you want to search for areas assigned to other users.
- Once the search options are completed, a map will appear with unassigned areas highlighted in red, as shown in the figure below.
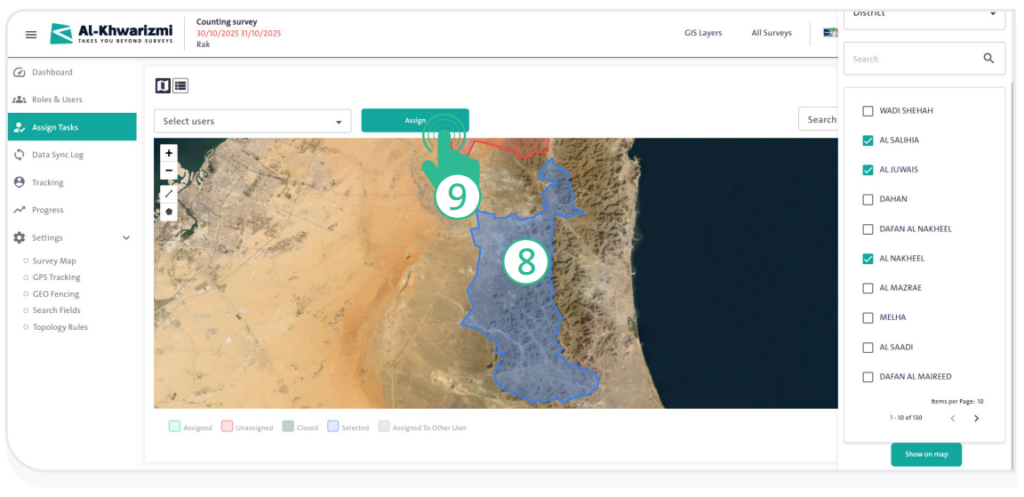
- Click the areas you want to assign; their color will change to blue.
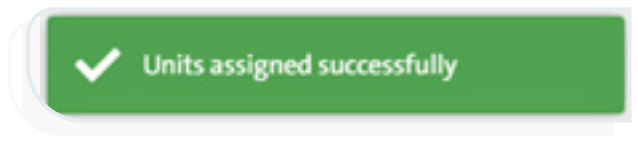
- Click “Assign” to change the assigned areas’ color to green. A notification will appear confirming that the assignment was successful, as shown in the adjacent figure.
INFO
- You can continue assigning tasks on the same map by following these steps:
- Select new areas on the map.
- Choose the user from the “Select Users” dropdown menu.
- Click “Assign”
 .
.
- You can remove the assignment of a layer using the map by following these steps:
- Select the assigned layer, indicated in green, which will turn blue when selected.
- Click “Unassign”
 .
.
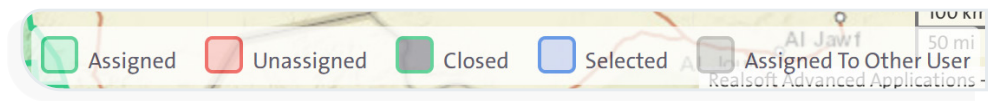
- The map uses different colors to represent task statuses. These colors can be customized and include:
- Blue – Selected areas
- Green – Assigned areas
- Red – Unassigned areas
- Dark Gray – Closed areas
- Light Gray – Areas assigned to another user
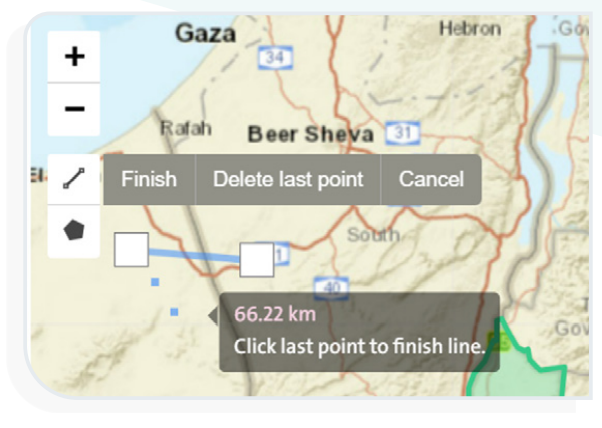
- You can measure distance on the map using the “Distance” icon
 by drawing a start point and an endpoint for the path you want to measure. The measurement result will be displayed as shown in the figure.
- Click the “polygon” icon
 to draw geographic boundaries in a polygon shape.
- You can control the map view using the following options:
- Click the zoom-in icon
 to enlarge the map view.
 - Click the zoom-out icon
 to reduce the map view.
- Click the zoom-in icon